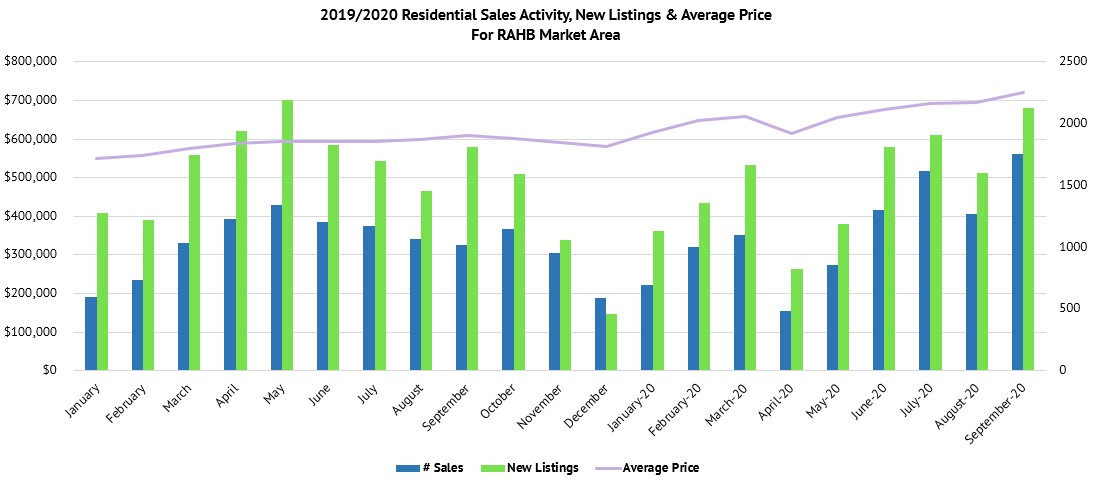
Hamilton, ON (October 2, 2020) – The REALTORS® Association of Hamilton-Burlington (RAHB) reported 1,751 sales of residential properties located within the RAHB market area were processed through the Multiple Listing Service® (MLS®) System in September 2020. Sales are up 37.67 per cent over last month and up 53.9 per cent over September of last year. New listings are up 32.67 per cent over August 2020 and up 8.5 per cent over last September. The average price for residential properties was $721,354, which is up 3.8 per cent from last month and up 19.8 per cent from September 2019. The number of active listings available at the end of the month was 40.4 per cent lower compared to the previous year.
“September is typically a busy month as we move into the Fall market; however, activity was some of the highest we have seen. Sales significantly increased in September over last month and last year, and average price was up 10 to 20 per cent in all of our major RAHB communities for those same time periods,” says RAHB President Kathy Della-Nebbia. “We also saw an increase in new listings in our area; however, there is a low number of active listings, which was down in September by over 40 per cent compared to the same month last year. This low inventory is driving the average price higher.”
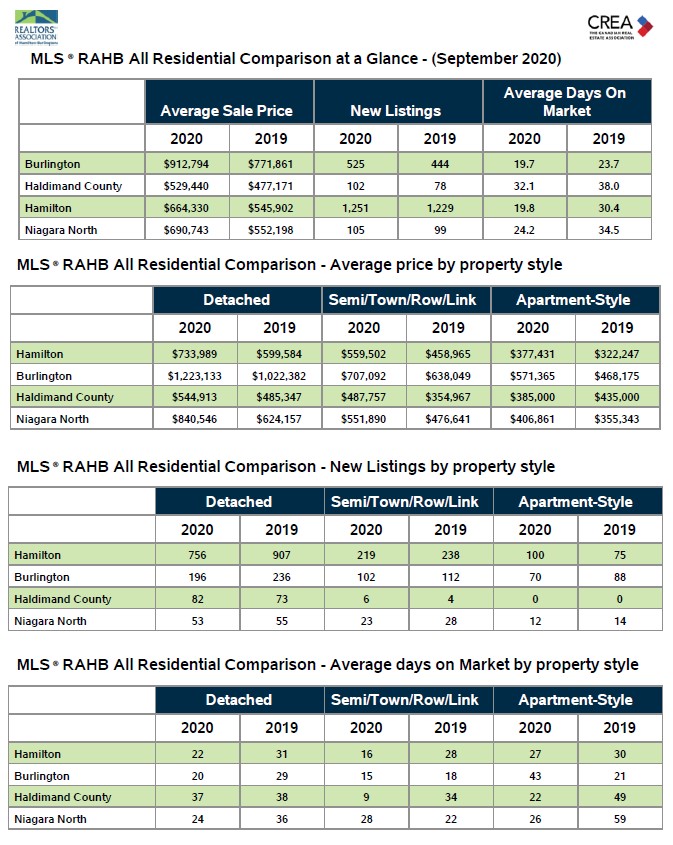
The number of sales for single family properties within the entire RAHB market increased in September by 39.5 per cent compared to the same month last year, the number of new listings was down 10.6 per cent over last year, and the average sale price increased by 19.6 per cent to $804,408. Townhouse sales activity across the entire RAHB market area increased from September 2019 by 56.1 per cent, new listings were up 16.2 per cent, and the townhouse average sale price increased by 17.3 per cent to $599,368. Apartment-style property sales increased by 37.6 per cent from September 2019, new listings increased by 17.6 per cent, and the average price increased by 15.4 per cent to $467,883.
“Consumer confidence greatly increased over the Summer when the province moved into stage three of recovery, and we saw market activity increase. This would have usually occurred in the Spring, but COVID-19 had a tremendous effect on the market at that time,” says Della-Nebbia. “As schools have reopened and more people go back to work, we are seeing the number of COVID-19 cases increase and we could see the effects of this on activity further into the Fall if we are unable to flatten the curve of the second wave.”
Della-Nebbia adds, “RAHB REALTORS® will continue to work with clients to ensure their housing needs are met, and will continue to use virtual technology and sanitary measures to combat COVID-19. If you are entering the market as either a buyer or seller, working with a local RAHB REALTOR® will help ensure your real estate transaction is both successful and safe.”
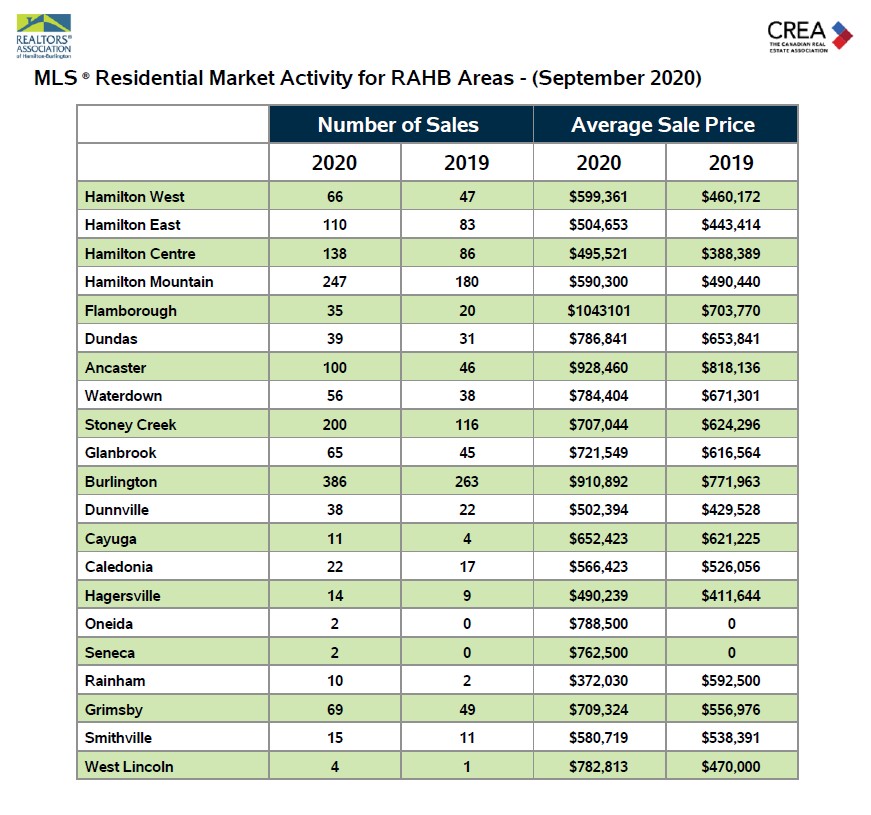
Specific neighbourhoods within the overall RAHB market area see results that often differ from the average of the entire RAHB market area. Because neighbourhoods vary, determining the right price and conditions when buying or selling a property can be challenging. Local RAHB REALTORS® have the experience, knowledge and tools to help buyers and sellers make those big decisions.
 (Trends are calculated from data collected through RAHB’s MLS®.)
*PLEASE NOTE* – As of October 7, 2020, the Residential Market Activity Table for RAHB Areas, RAHB Residential Activity Map, and Top 3 Stats video have been updated with new data. We discovered an error and have corrected it.
Source: rahb.ca/september-2020-market-statistics/